
Blog ·
How Does Any OS Graphics Performance Compare to Native?
How big is the gap between 3DMark in a Windows VM on a Mac and native? We measured 8 benchmarks at 4K full screen on the same Mac Studio.
How Much Graphics Performance Does a Windows VM on a Mac Deliver?
How different is it to run games in a Windows VM on a Mac versus running them natively? While building Any OS, this is a question we kept wanting to answer ourselves.
In Any OS, the DirectX 12 and Vulkan calls sent by the guest Windows are handled by the host Mac through Metal. A macOS app calls Metal directly, so the VM path adds one extra step. We measured how much that step costs with 3DMark on the same Mac.
Two questions we wanted to answer
- 1.What percentage of native does Any OS graphics performance reach?
- 2.Do DirectX 12 benchmarks run without errors in a Windows VM on a Mac?
The short version
- In 4 of the 5 benchmarks we compared, the Any OS VM reached about 90% of native or more.
- Solar Bay was 129.9% and Steel Nomad Light was 136.3%, both faster than Mac native.
- Solar Bay Extreme at 89.3% and Wild Life Extreme at 92.7% came very close to native.
- The Any OS VM on a Mac performs between the NVIDIA RTX 4060 Ti and 4070, the level of a mid-range graphics card.
- The heaviest benchmark, Steel Nomad, reached 76.9% (DirectX 12).
- All 5 DirectX 12 benchmarks (Steel Nomad, Steel Nomad Light, Wild Life Extreme, Speed Way, Port Royal) ran in the VM without errors and produced scores.
Test Hardware
| Item | Mac native | Any OS VM | Windows PC (RTX 4090) |
|---|---|---|---|
| Chip | Apple M5 Max | Apple M5 Max (host) | Intel Core i9-13900HX |
| vCPU | N/A | 8 | N/A |
| GPU | 40-core GPU | Virtual GPU (handled by the Mac GPU through Metal) | RTX 4090 Laptop GPU |
| Memory | 128 GB | 16 GB | 32 GB |
| OS | macOS 27.2 | Windows 11 ARM64 | Windows 11 x64 |
| 3DMark app version | 1.1.350 | 2.32.8919 | 2.32.8919 |
| Graphics API | Metal | DirectX 12, Vulkan | DirectX 12, Vulkan |
| Display | 4K full screen | 4K full screen (guest 3840×2160) | Full screen |
Mac native and the Any OS VM were measured on the same Mac Studio.
Test Conditions
| Item | Mac native | Any OS VM | Windows PC (RTX 4090) |
|---|---|---|---|
| Preset | Default | Default | Default |
| Display | Full screen | Full screen | Full screen |
| API selection | None (Metal) | 2 Steel Nomad benchmarks | 2 Steel Nomad benchmarks |
- The benchmarks that let you pick an API are Steel Nomad and Steel Nomad Light, and we measured each with DirectX 12 and with Vulkan.
- VM ÷ native is the VM score divided by the Mac native score.
Which Benchmarks We Ran
| Benchmark | Focus | Render resolution | Ray tracing | API on Windows |
|---|---|---|---|---|
| Solar Bay Extreme | Heavy ray tracing for mobile devices | 2560×1440 | Yes | Vulkan |
| Wild Life Extreme | Shared across Windows, Mac, and mobile devices | 3840×2160 | No | Automatic per device |
| Steel Nomad | For high-performance gaming PCs | 3840×2160 | No | DirectX 12, Vulkan |
| Steel Nomad Light | For lighter PCs | 2560×1440 | No | DirectX 12, Vulkan |
| Solar Bay | Vulkan 1.1, ray tracing for Metal | 2560×1440 | Yes | Vulkan |
| Speed Way | DirectX 12 Ultimate for gaming PCs | 2560×1440 | Yes | DirectX 12 |
| Port Royal | Real-time ray tracing | 2560×1440 | Yes | DirectX 12 |
| Wild Life | For mobile devices | 2560×1440 | No | No selection |
- Wild Life Extreme runs with DirectX 12 on ARM-based Windows and with Vulkan on x64 Windows.
- Solar Bay Extreme has more detailed scenes and a heavier ray tracing load than Solar Bay.
- Speed Way, Port Royal, and Wild Life are not in 3DMark for macOS, so we did not compare them with native.
Are 3DMark for Mac and 3DMark for Windows the Same Program?
The two apps share a name but are different programs. The app versions differ, and for all five benchmarks available on both Mac and Windows, the workload versions differ too. That makes it hard to compare the scores from the two apps directly.
| Version | 3DMark for macOS | 3DMark for Windows |
|---|---|---|
| App | 1.1.350 | 2.32.8919 |
| Solar Bay workload | 1.0.17.4 | 1.0.18.1 |
| Solar Bay Extreme workload | 1.0.3.6 | 1.0.6.2 |
| Steel Nomad Light workload | 1.0.6.2 | 1.0.5.1 |
| Steel Nomad workload | 1.0.6.2 | 1.0.5.1 |
| Wild Life Extreme workload | 1.1.14.3 | 1.1.14.1 |
On Windows, the Steel Nomad family has a separate workload for each API.
| Benchmark | macOS workload | Windows workload |
|---|---|---|
| Steel Nomad Light | SteelNomadGt1LT | SteelNomadGt1DXLT, SteelNomadGt1VKLT |
| Steel Nomad | SteelNomadGt1P | SteelNomadGt1DX, SteelNomadGt1VK |
- Solar Bay, Solar Bay Extreme, and Wild Life Extreme have the same workload names in both apps.
- For the Solar Bay family, the ray tracing method is inline on both Mac native and the Any OS VM, and pipeline on the Windows PC.
Results at a Glance
- Green bold text marks the higher score between Mac native and the Any OS VM. The Windows PC (RTX 4090) column is for reference only, so it is not marked.
- In the VM ÷ native column, the two benchmarks with similar workloads are shown in green and Steel Nomad, with the largest gap, in orange. Values above 100% are not colored.
| Benchmark | VM API | Mac native (Metal) | Any OS VM | VM ÷ native | Windows PC (RTX 4090) |
|---|---|---|---|---|---|
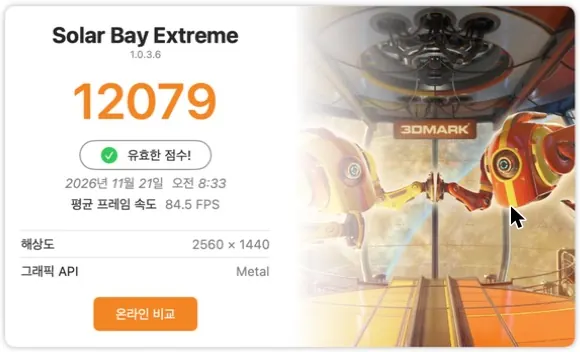
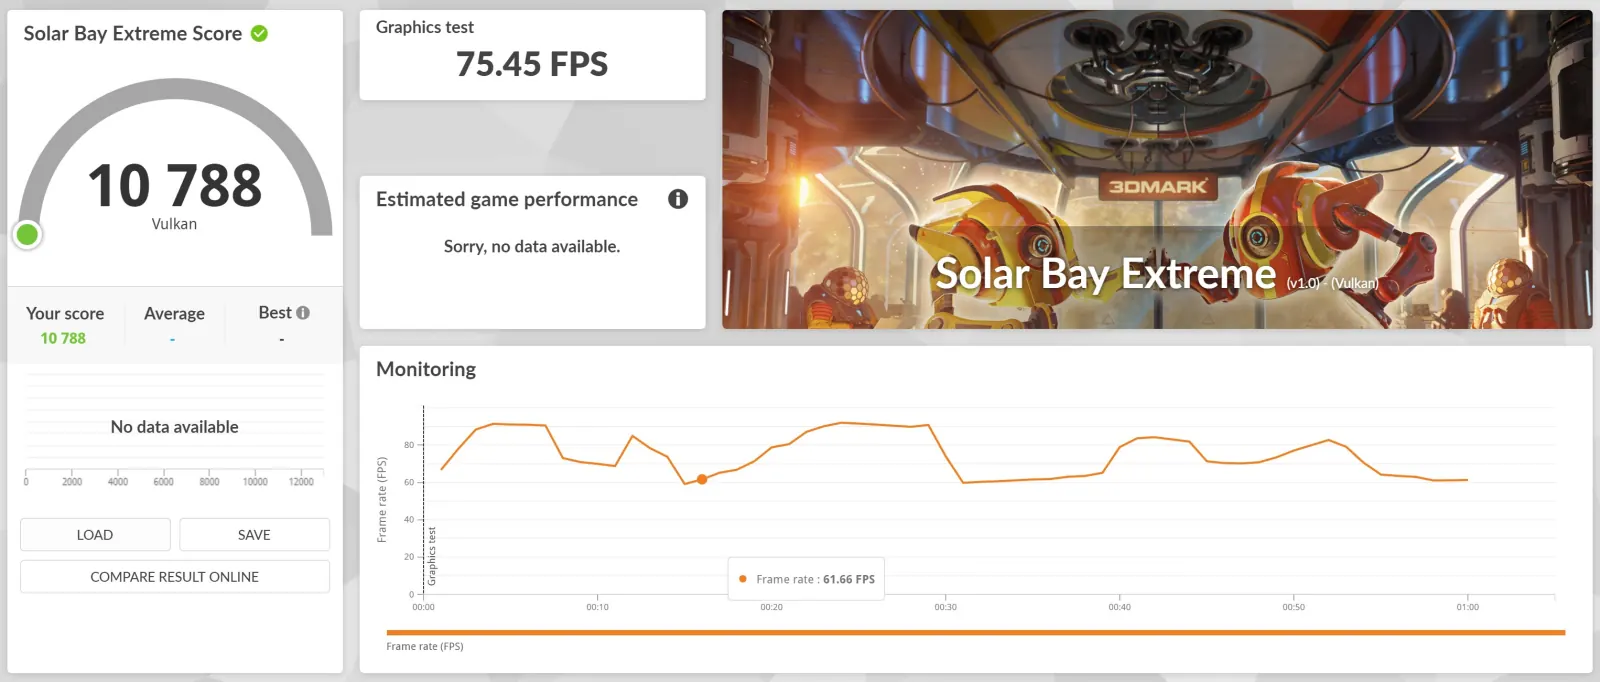
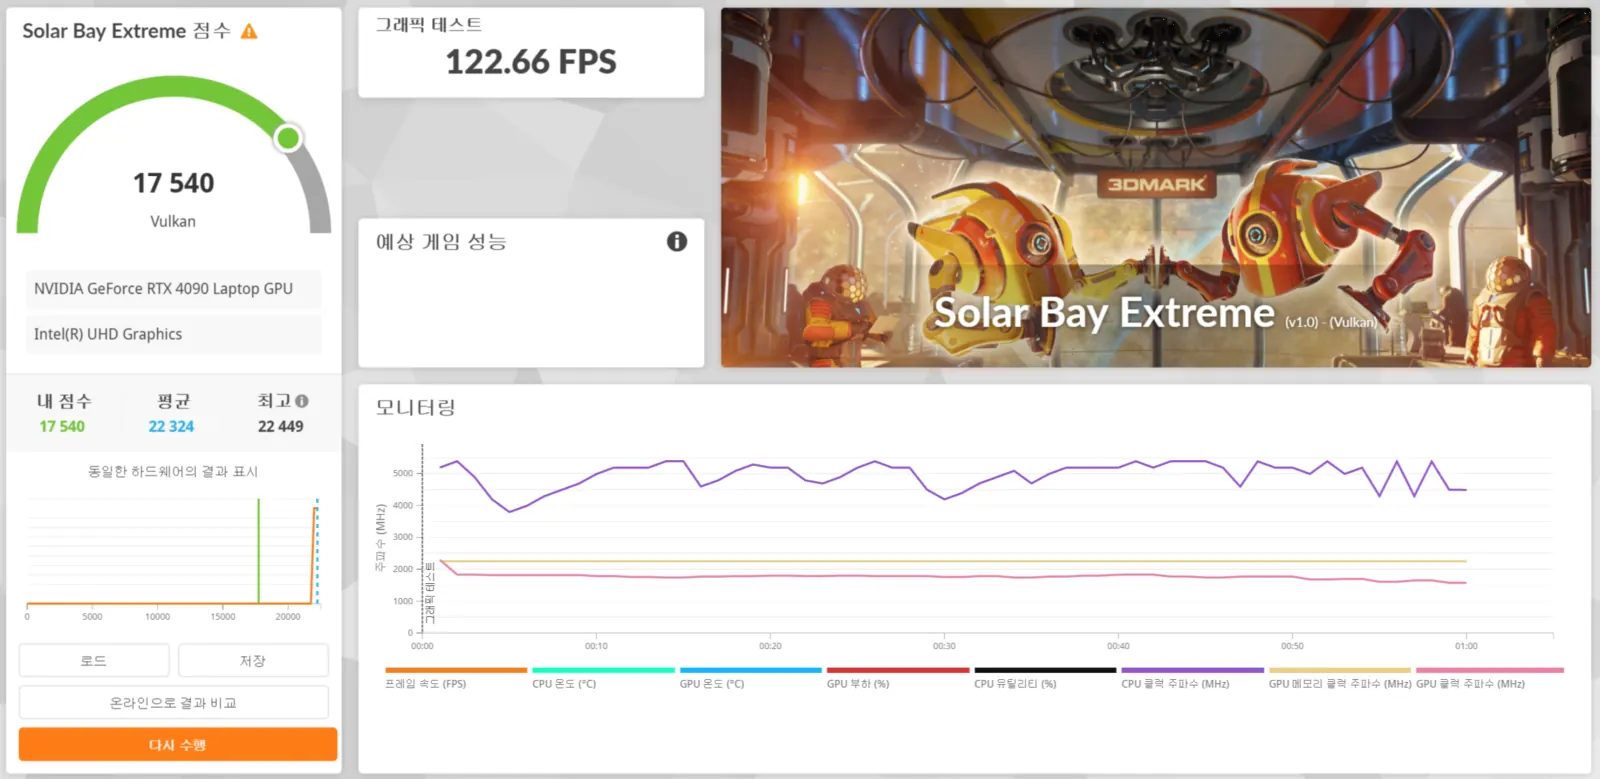
| Solar Bay Extreme | Vulkan | 12,079 pts / 84.47 FPS | 10,788 pts / 75.45 FPS | 89.3% | 17,540 pts / 122.66 FPS |
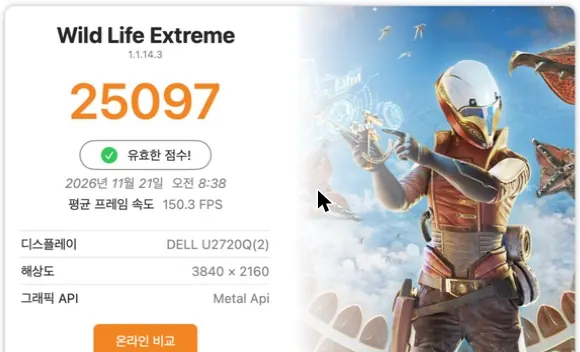
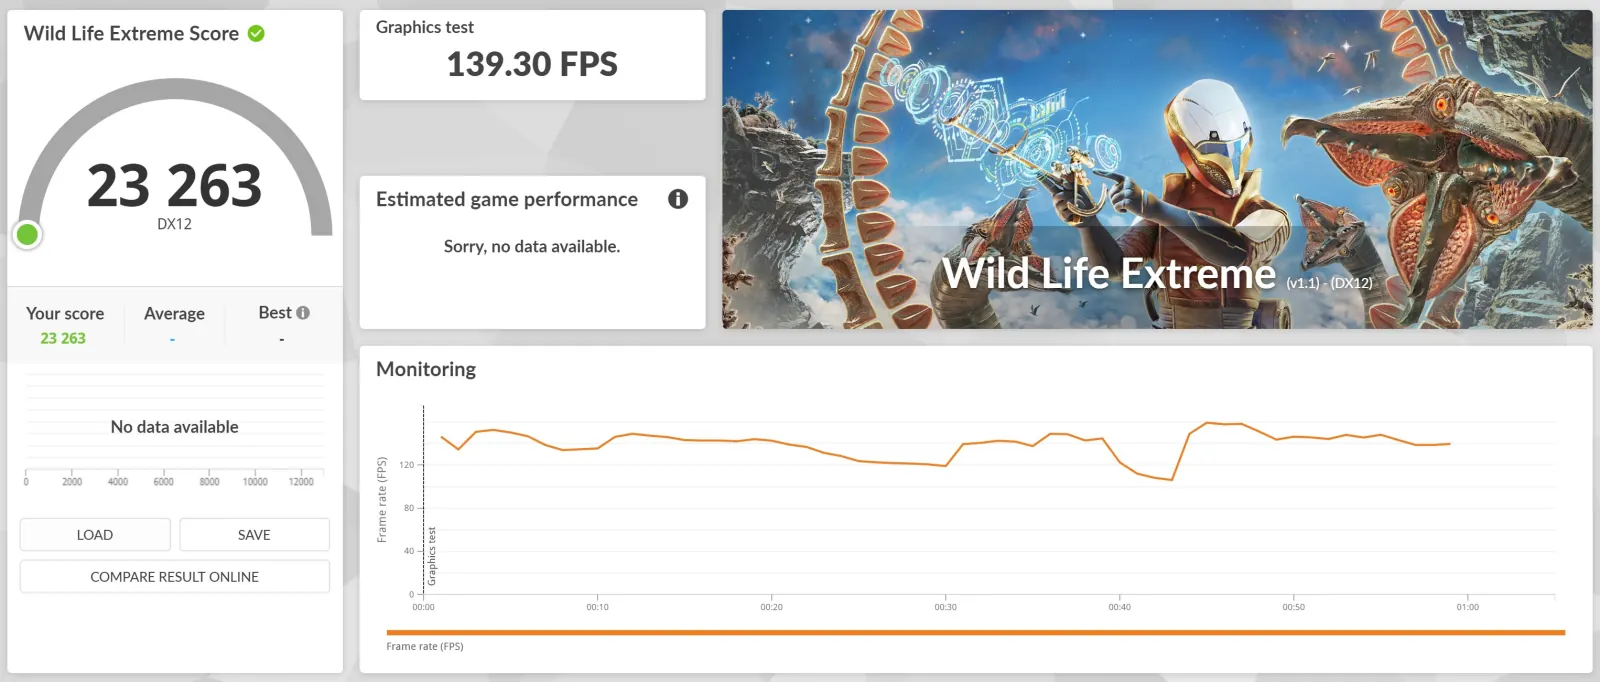
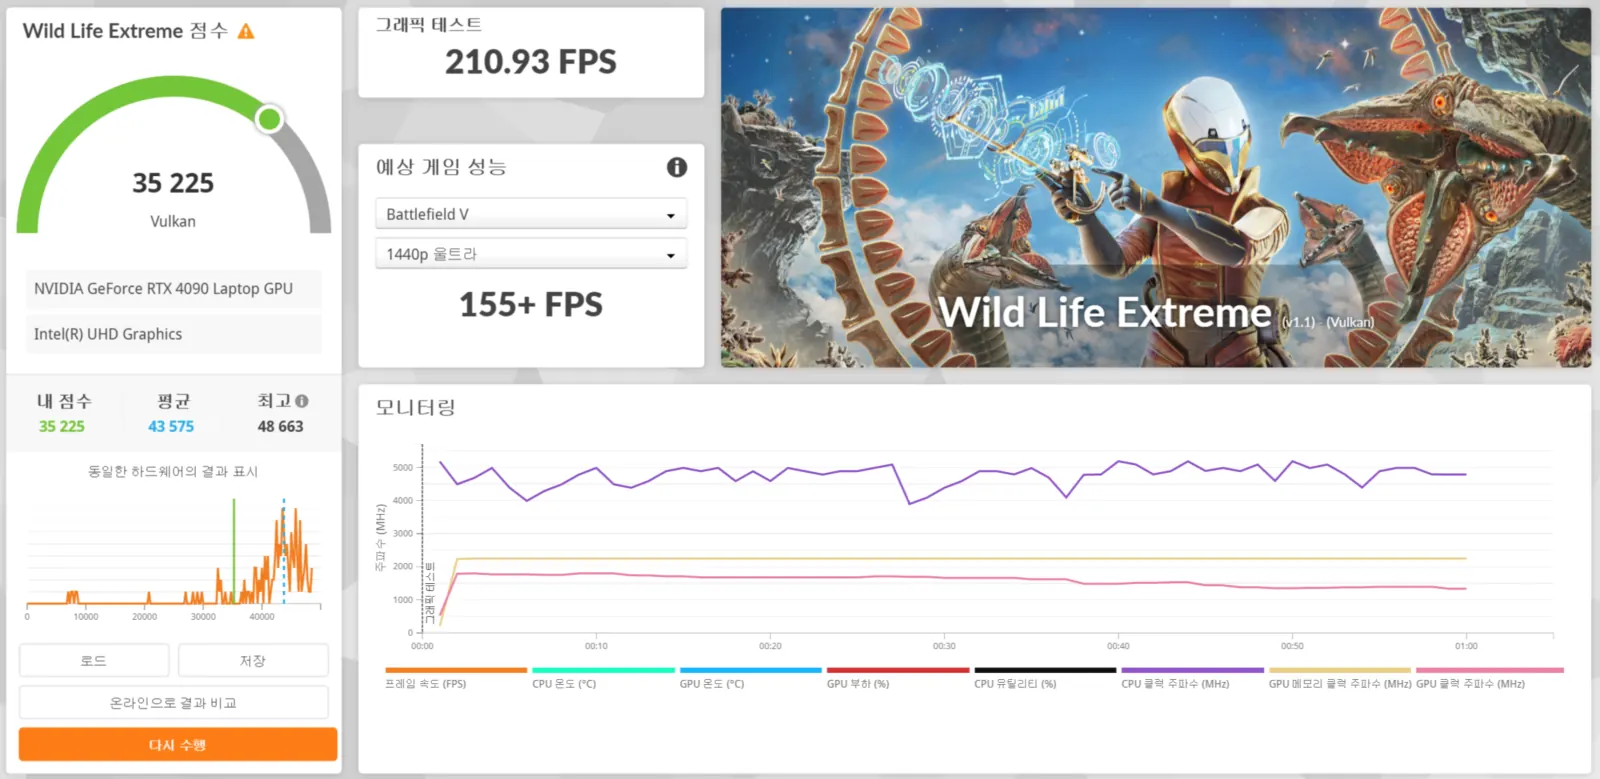
| Wild Life Extreme | DirectX 12 | 25,097 pts / 150.29 FPS | 23,263 pts / 139.30 FPS | 92.7% | 35,225 pts / 210.93 FPS (Vulkan) |
| Steel Nomad | DirectX 12 | 4,548 pts / 45.48 FPS | 3,499 pts / 34.99 FPS | 76.9% | 4,580 pts / 45.80 FPS |
| Steel Nomad | Vulkan | 4,548 pts / 45.48 FPS | 3,000 pts / 30.01 FPS | 66.0% | 4,589 pts / 45.89 FPS |
| Steel Nomad Light | DirectX 12 | 9,488 pts / 70.28 FPS | 12,933 pts / 95.81 FPS | 136.3% | 20,881 pts / 154.68 FPS |
| Steel Nomad Light | Vulkan | 9,488 pts / 70.28 FPS | 13,924 pts / 103.14 FPS | 146.8% | 20,128 pts / 149.10 FPS |
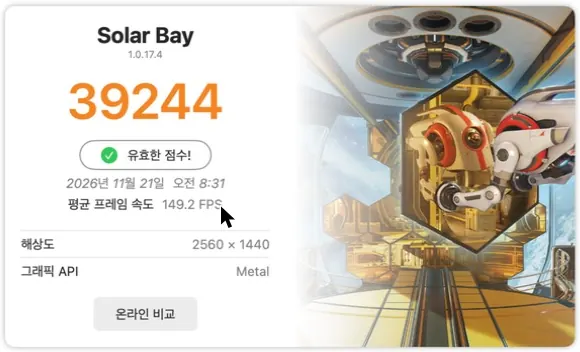
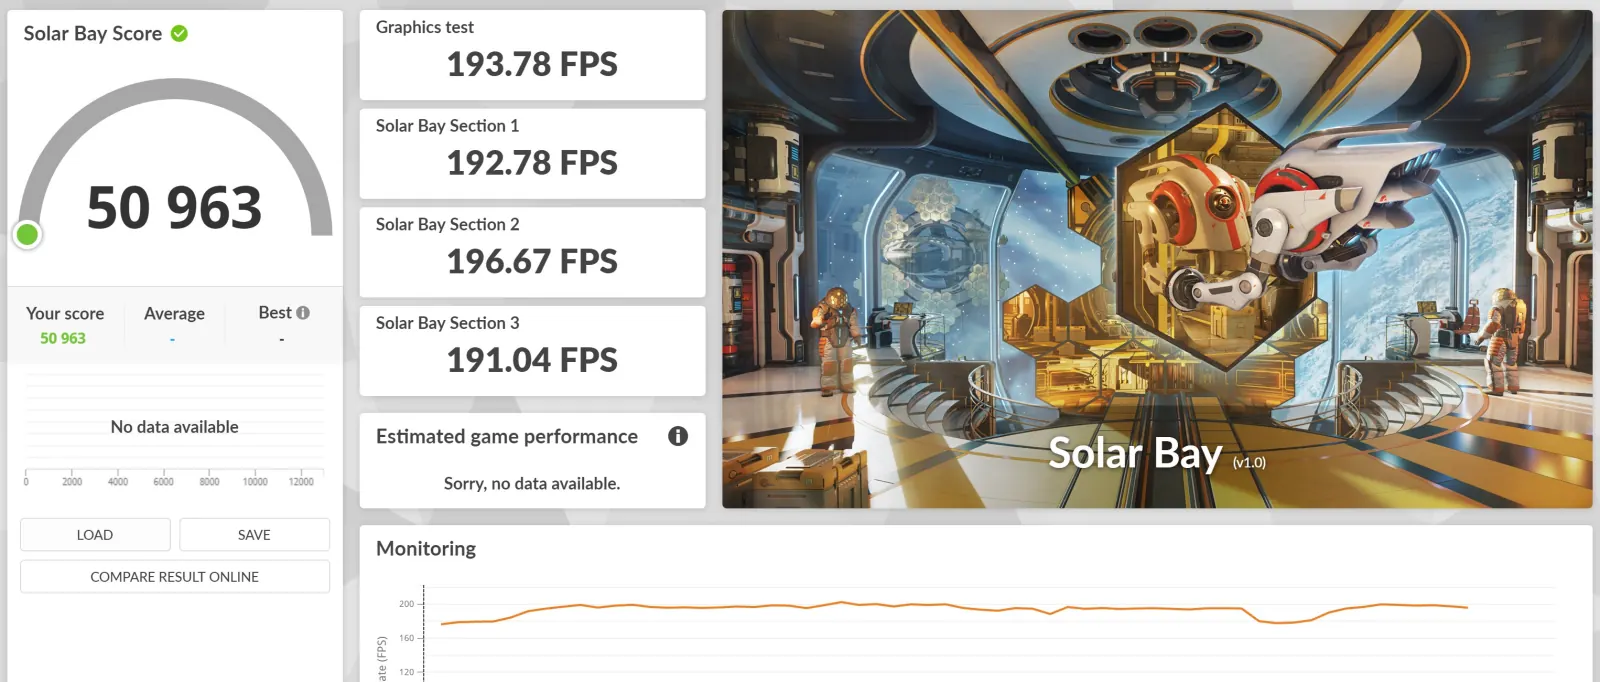
| Solar Bay | Vulkan | 39,244 pts / 149.22 FPS | 50,963 pts / 193.78 FPS | 129.9% | 85,342 pts / 324.50 FPS |
| Speed Way | DirectX 12 | No macOS version | 3,361 pts / 33.61 FPS | - | 5,203 pts / 52.03 FPS |
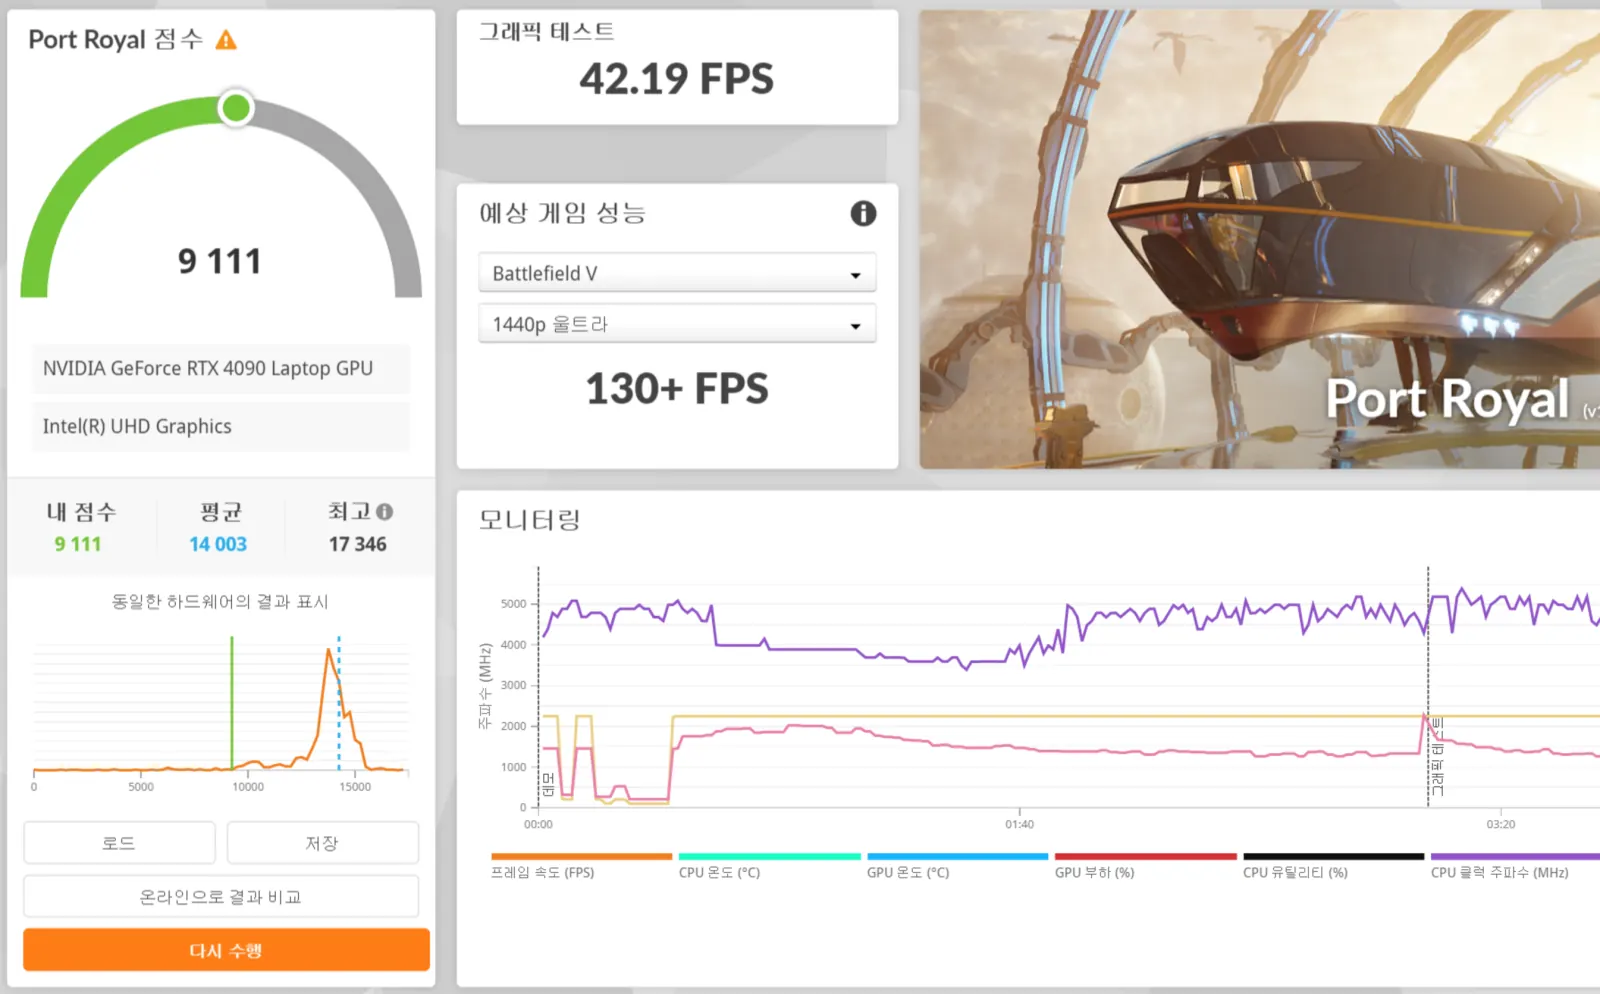
| Port Royal | DirectX 12 | No macOS version | 8,463 pts / 39.18 FPS | - | 9,111 pts / 42.19 FPS |
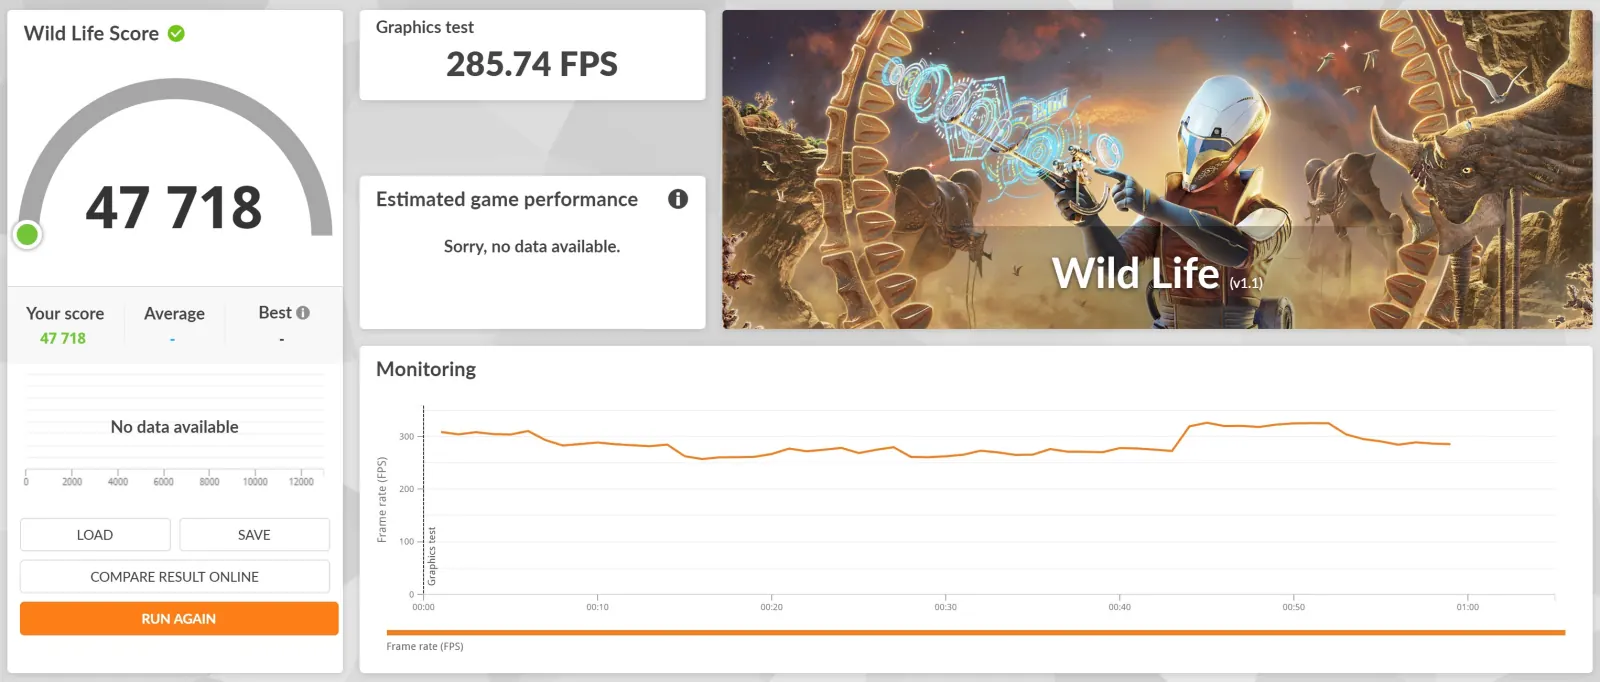
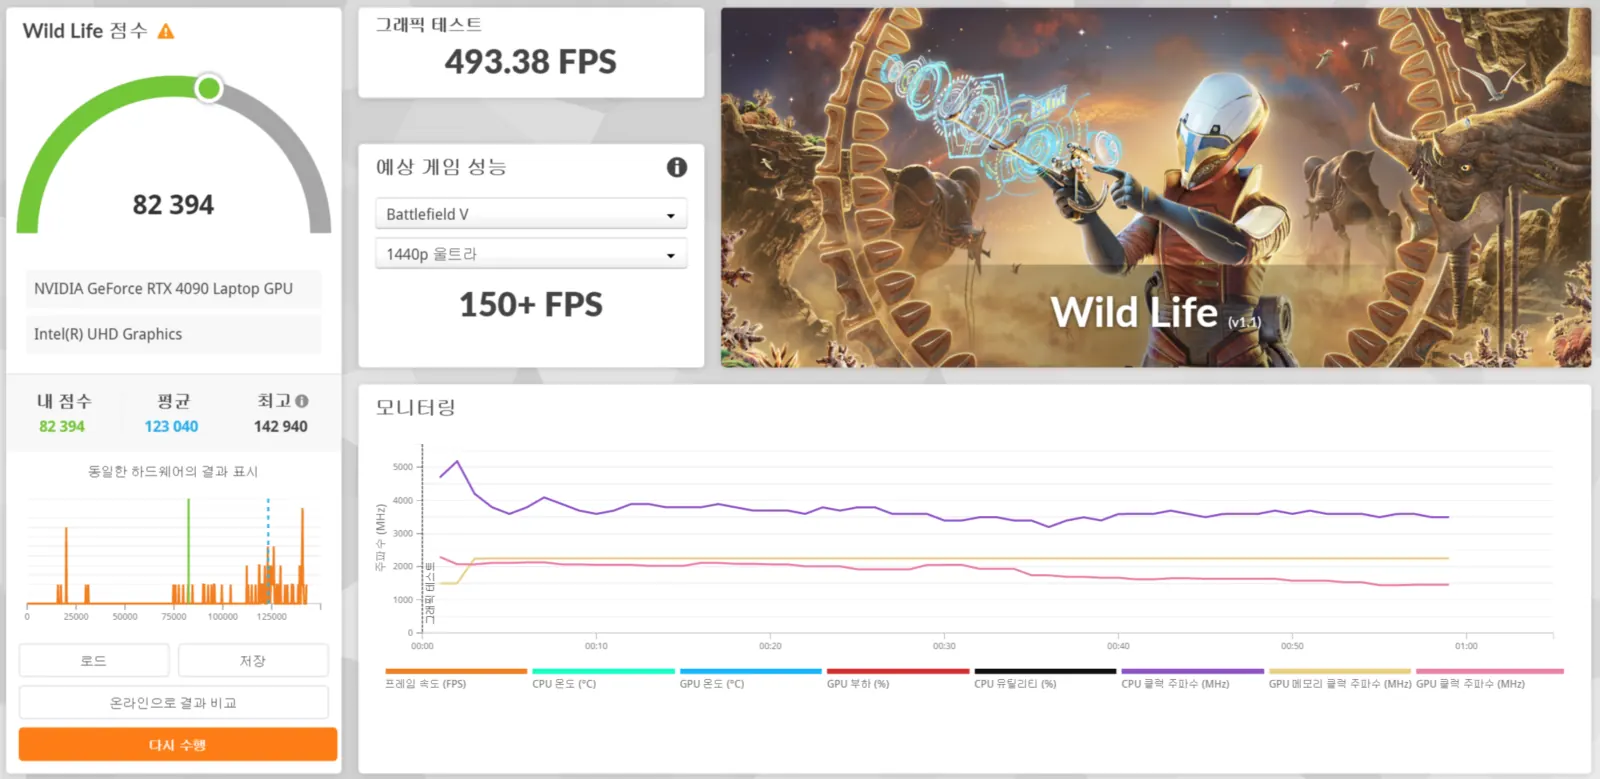
| Wild Life | No selection | No macOS version | 47,718 pts / 285.74 FPS | - | 82,394 pts / 493.38 FPS |
The Two Benchmarks with Similar Workloads Reach About 90%
Solar Bay Extreme
| Item | Mac native | Any OS VM | Windows PC (RTX 4090) |
|---|---|---|---|
| API | Metal | Vulkan | Vulkan |
| Score / average FPS | 12,079 pts / 84.47 FPS | 10,788 pts / 75.45 FPS | 17,540 pts / 122.66 FPS |
| VM ÷ native | - | 89.3% | - |
Wild Life Extreme
| Item | Mac native | Any OS VM | Windows PC (RTX 4090) |
|---|---|---|---|
| API | Metal | DirectX 12 | Vulkan |
| Score / average FPS | 25,097 pts / 150.29 FPS | 23,263 pts / 139.30 FPS | 35,225 pts / 210.93 FPS |
| VM ÷ native | - | 92.7% | - |
- In the VM, Vulkan could only be selected in a Custom run, which produces no score, and it averaged 161.93 FPS.
Why we used these two benchmarks as the reference
These two benchmarks have the same workload names and render resolutions in the Mac and Windows apps. For Wild Life Extreme, the workload versions differ only in the last digit. They are the pairs that let us compare the VM and native under the most similar conditions, so we used them as the reference.
Converting average FPS to frame time, Solar Bay Extreme goes from 11.84 ms to 13.25 ms and Wild Life Extreme goes from 6.65 ms to 7.18 ms. That is 1.4 ms and 0.5 ms more per frame. The OS, API, app build, and display path all changed together, so this is not the virtualization cost in isolation.
The Heaviest Benchmark, Steel Nomad, Reaches 76.9%
| API | Mac native | Any OS VM | Windows PC (RTX 4090) |
|---|---|---|---|
| DirectX 12 | 4,548 pts / 45.48 FPS (Metal) | 3,499 pts / 34.99 FPS | 4,580 pts / 45.80 FPS |
| Vulkan | 4,548 pts / 45.48 FPS (Metal) | 3,000 pts / 30.01 FPS | 4,589 pts / 45.89 FPS |
| VM ÷ native | - | 76.9% (DirectX 12), 66.0% (Vulkan) | - |
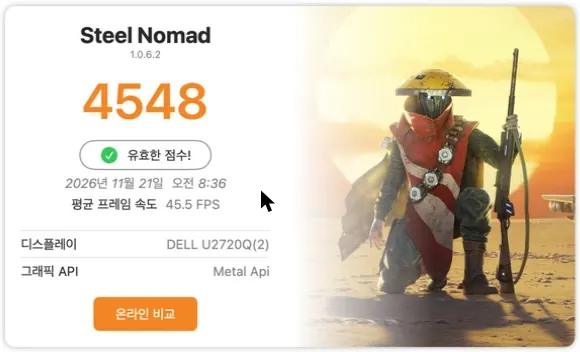
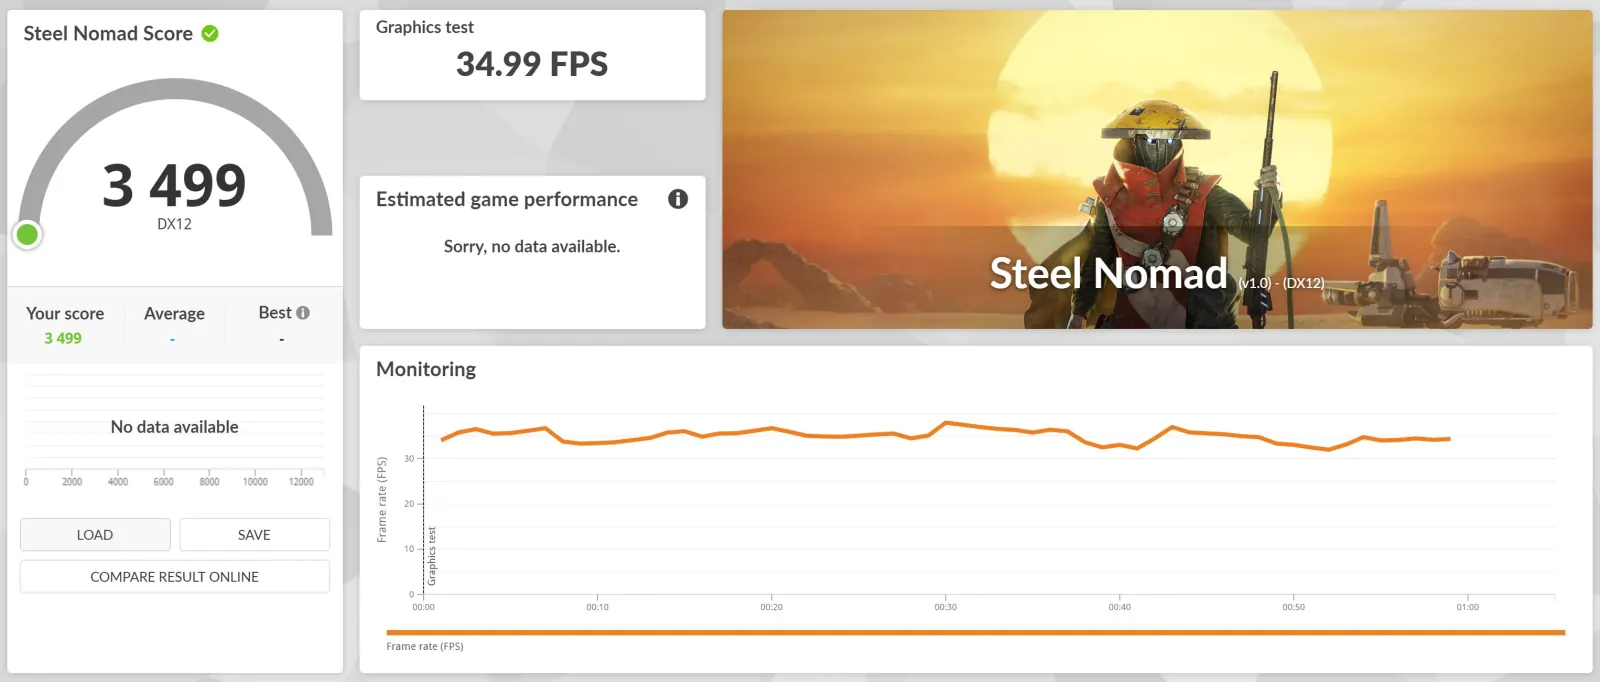
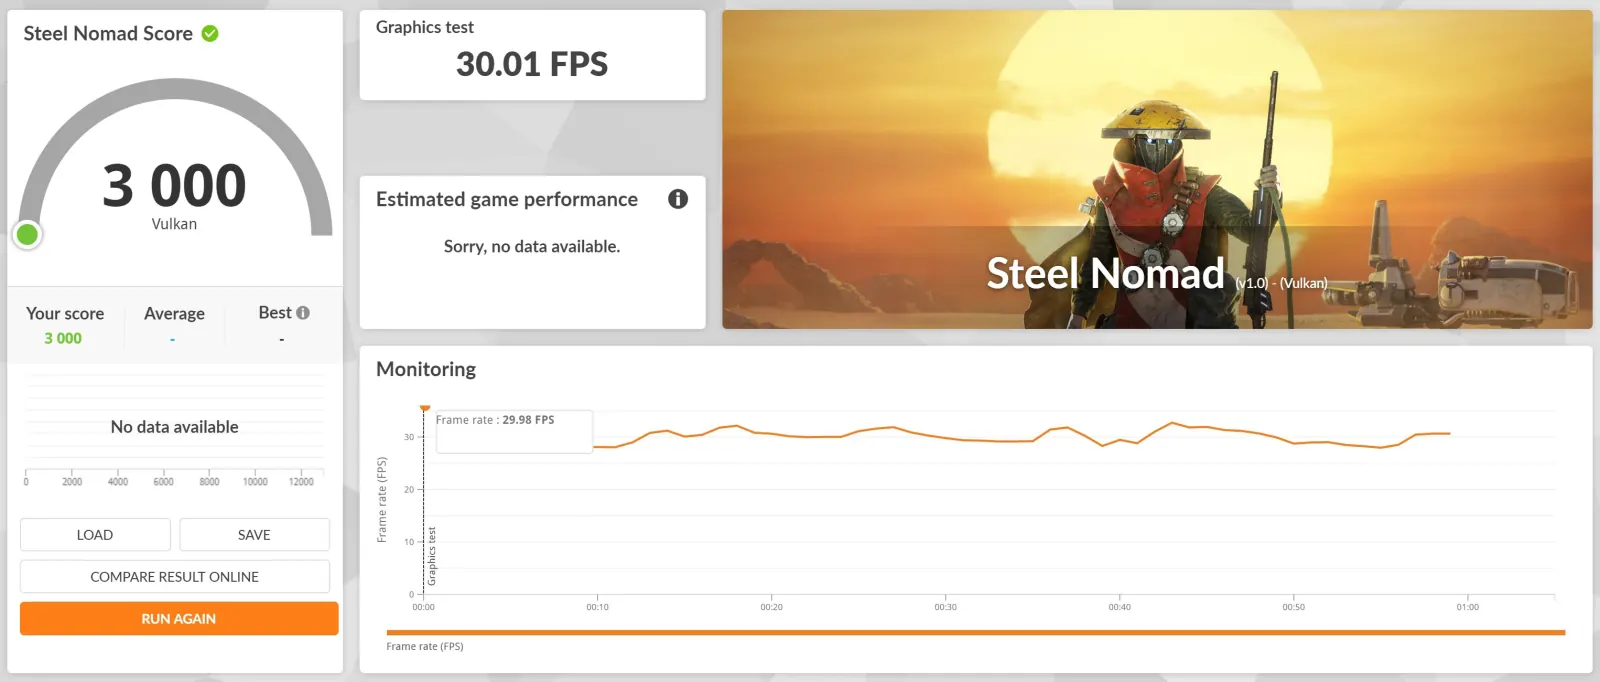
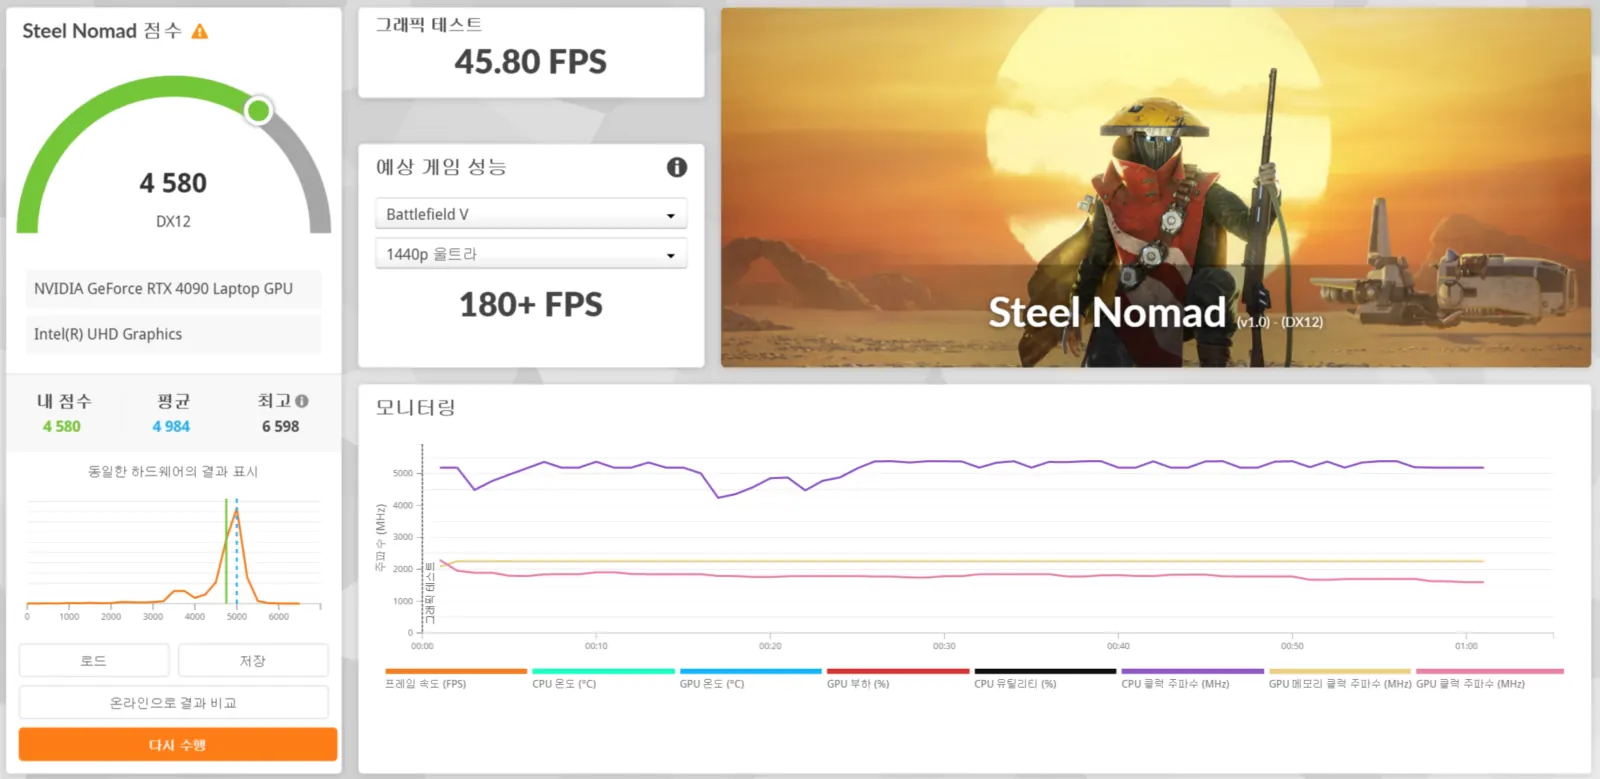
This is the heaviest benchmark, rendering at 4K. With DirectX 12, a frame goes from 21.99 ms to 28.58 ms, about 6.6 ms more. Steel Nomad has different workload names and versions in the two apps, so this measurement could not tell how much of the 76.9% is attributable to Any OS.
In the VM, DirectX 12 scored 16.6% higher than Vulkan. That difference alone is too little to say which API is better.
Comparison with NVIDIA Graphics Cards
We compared the Steel Nomad score with the median score of each NVIDIA graphics card. The Any OS VM scored 3,499 pts (DirectX 12).
| GPU | Steel Nomad median | Relative to the Any OS VM (3,499 pts) |
|---|---|---|
| GeForce RTX 5070 | 5,340 pts | Higher than the VM |
| GeForce RTX 4070 | 3,845 pts | Higher than the VM |
| GeForce RTX 5060 Ti | 3,592 pts | Similar to the VM |
| GeForce RTX 3070 Ti | 3,501 pts | Similar to the VM |
| GeForce RTX 4060 Ti 8 GB | 2,907 pts | Lower than the VM |
The Any OS VM on the M5 Max scored close to the RTX 3070 Ti and 5060 Ti. It lands between the RTX 4060 Ti and 4070, the performance level of an NVIDIA mid-range graphics card.
Comparison with Other VM Apps
We summarized the public information on other VM apps that run Windows on a Mac, using the same criteria.
| VM app | DirectX 12 benchmark scores published |
|---|---|
| Any OS | Yes (this post) |
| Parallels Desktop | Not found |
| VMware Fusion | Not found |
| UTM | Not found |
Any OS ran 5 DirectX 12 benchmarks and produced scores, and in Solar Bay and Steel Nomad Light it scored higher than Mac native. We could not find DirectX 12 benchmark scores under the same conditions published for the other VM apps.
Solar Bay and Steel Nomad Light, Where the VM Scored Higher
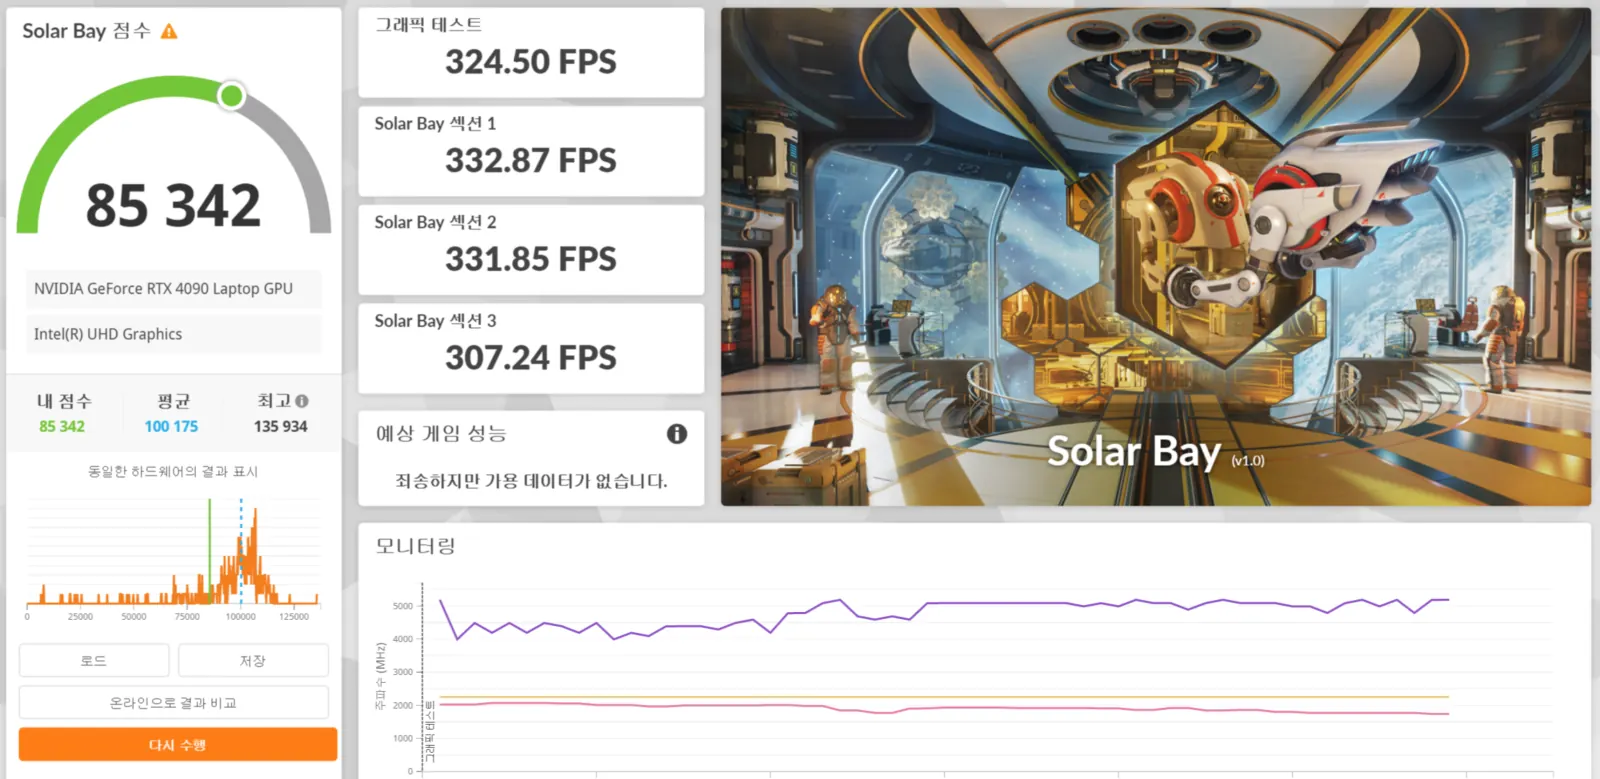
Solar Bay
| Item | Mac native | Any OS VM | Windows PC (RTX 4090) |
|---|---|---|---|
| API | Metal | Vulkan | Vulkan |
| Score / average FPS | 39,244 pts / 149.22 FPS | 50,963 pts / 193.78 FPS | 85,342 pts / 324.50 FPS |
| VM ÷ native | - | 129.9% | - |
Steel Nomad Light
| API | Mac native | Any OS VM | Windows PC (RTX 4090) |
|---|---|---|---|
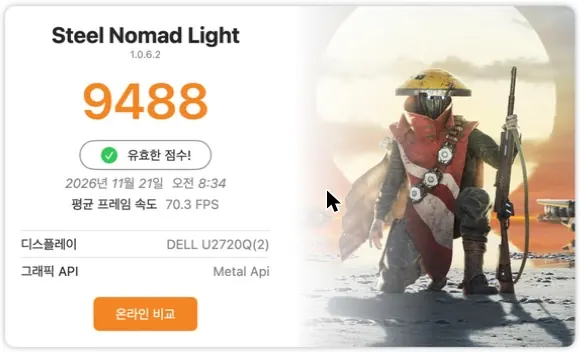
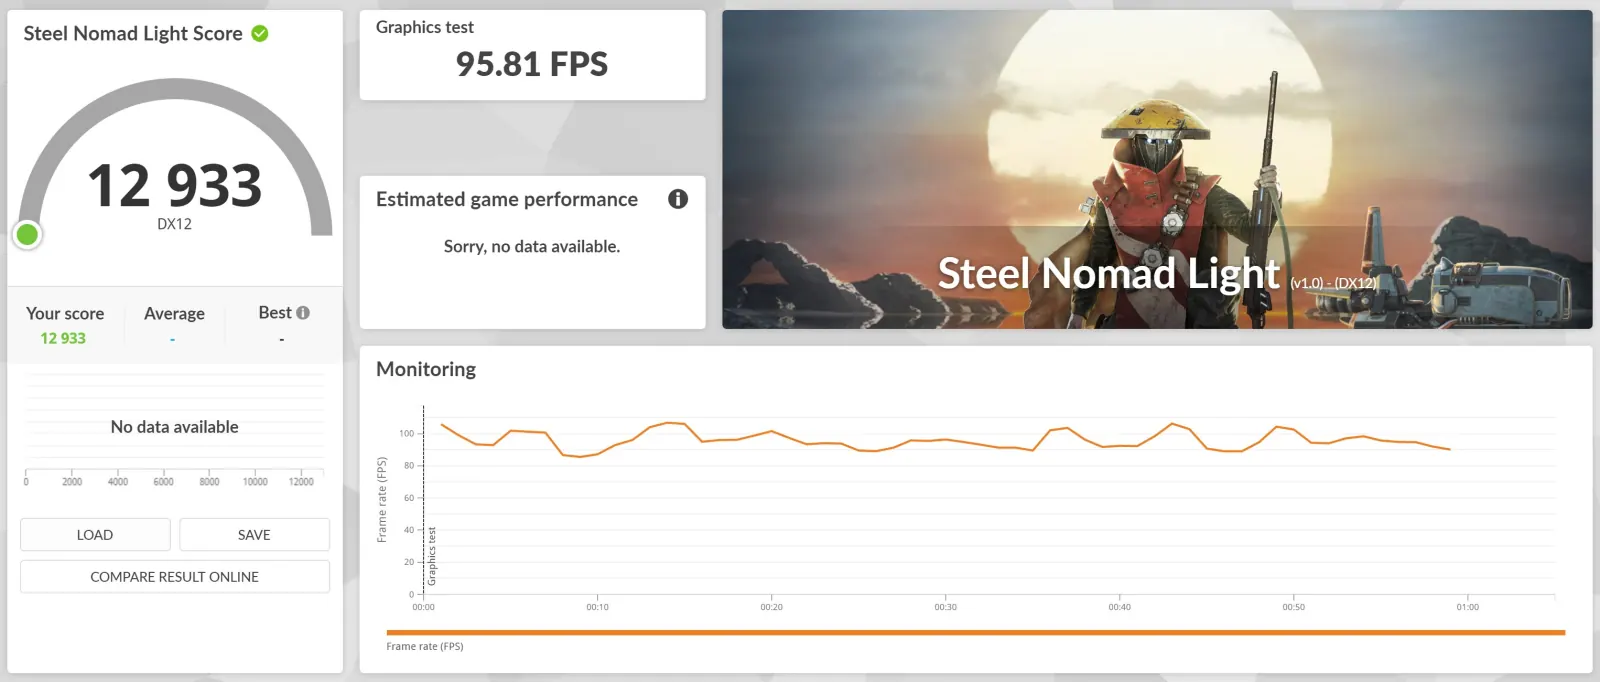
| DirectX 12 | 9,488 pts / 70.28 FPS (Metal) | 12,933 pts / 95.81 FPS | 20,881 pts / 154.68 FPS |
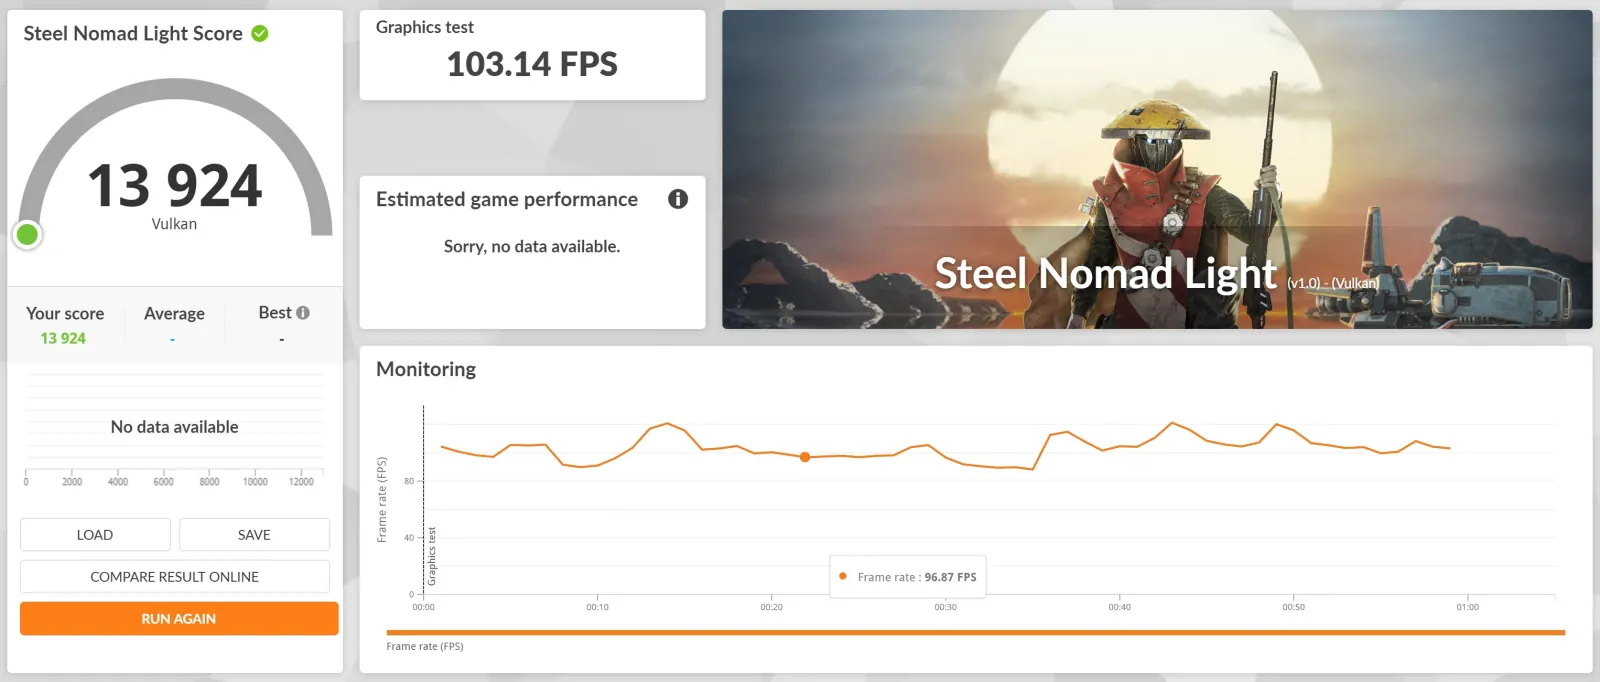
| Vulkan | 9,488 pts / 70.28 FPS (Metal) | 13,924 pts / 103.14 FPS | 20,128 pts / 149.10 FPS |
| VM ÷ native | - | 136.3% (DirectX 12), 146.8% (Vulkan) | - |
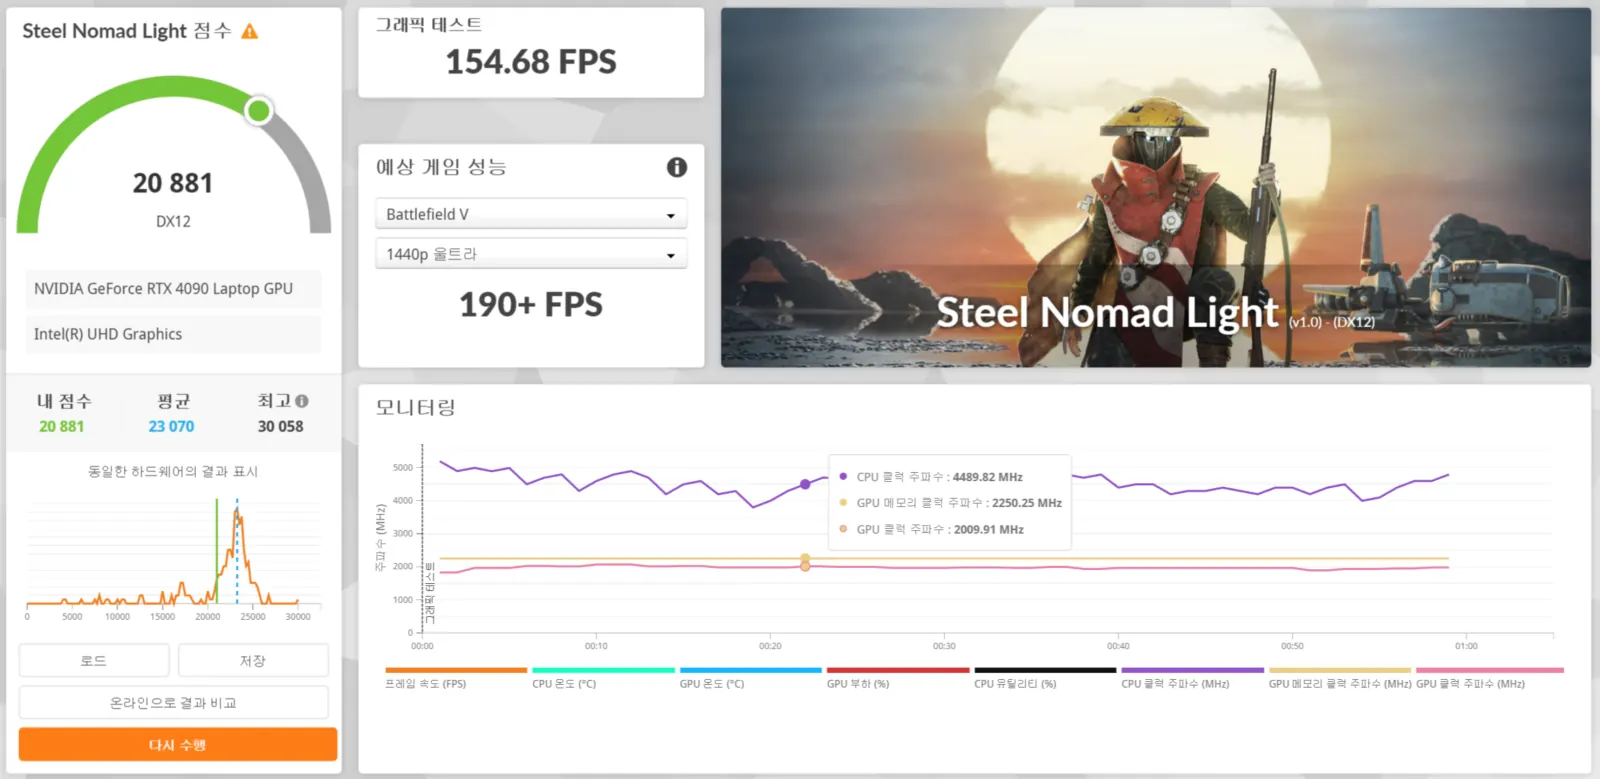
Why did the VM score higher?
In these two benchmarks, the Any OS VM scored higher than Mac native. This measurement alone could not pin down the cause. Here we separate what we confirmed from possible explanations.
- Confirmed: the two apps differ in both app version and workload version.
- Confirmed: within the same app, the ratio of the lighter benchmark score to the heavier benchmark score is similar for the two machines that use the Windows app, and only the macOS app differs (see the table below).
- Possible: the platform-specific implementation and optimization of 3DMark for macOS and for Windows may differ.
- Possible: Metal, DirectX 12, and Vulkan follow different graphics API paths.
- Possible: the efficiency of the path handled by the host Mac GPU may differ.
| Score ratio | Mac native | Any OS VM | Windows PC (RTX 4090) |
|---|---|---|---|
| Steel Nomad Light ÷ Steel Nomad | 2.09 | 3.70 (DirectX 12), 4.64 (Vulkan) | 4.56 (DirectX 12), 4.39 (Vulkan) |
| Solar Bay ÷ Solar Bay Extreme | 3.25 | 4.72 | 4.87 |
Three Benchmarks Available Only on Windows
Speed Way, Port Royal, and Wild Life cannot be compared with native, so we only checked that they run without errors in a Windows VM on a Mac, and looked at the scores.
| Benchmark | API | Any OS VM | Windows PC (RTX 4090) |
|---|---|---|---|
| Speed Way | DirectX 12 Ultimate | 3,361 pts / 33.61 FPS | 5,203 pts / 52.03 FPS |
| Port Royal | DirectX 12 | 8,463 pts / 39.18 FPS | 9,111 pts / 42.19 FPS |
| Wild Life | No selection | 47,718 pts / 285.74 FPS | 82,394 pts / 493.38 FPS |
- Speed Way and Port Royal, the DirectX 12 benchmarks that use ray tracing, ran in the VM without errors and produced scores.
- We could not confirm which API Wild Life used in the VM.
Speed Way
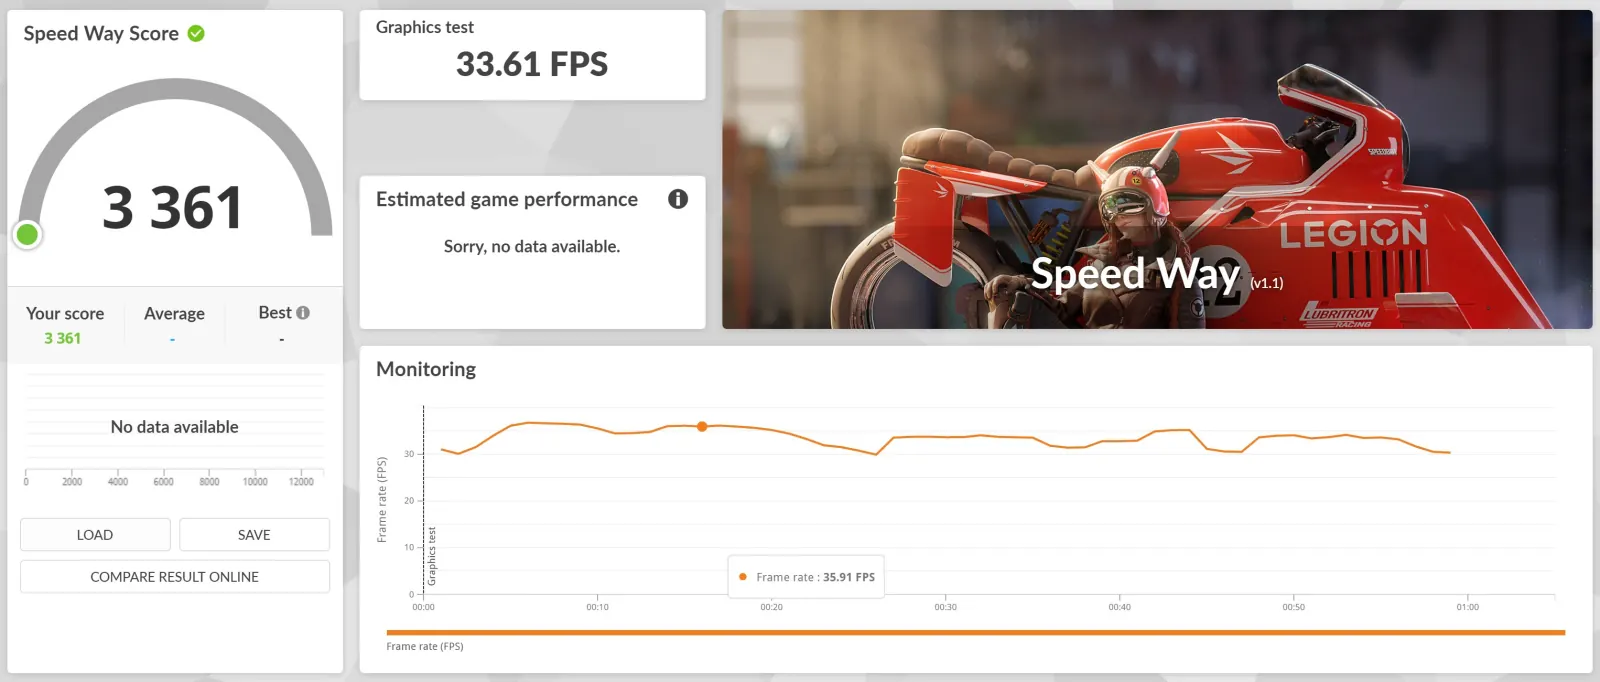
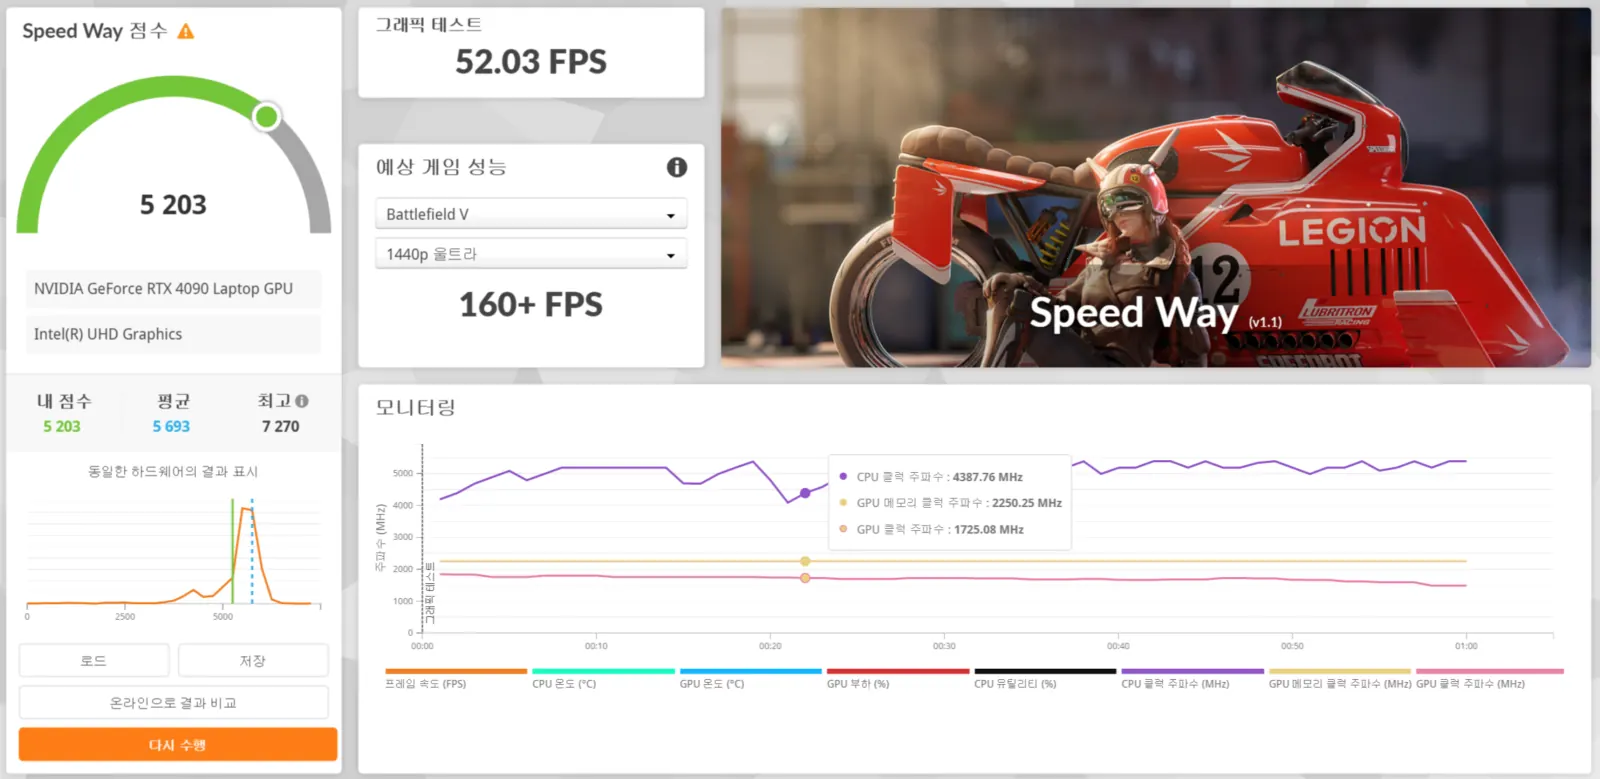
Port Royal
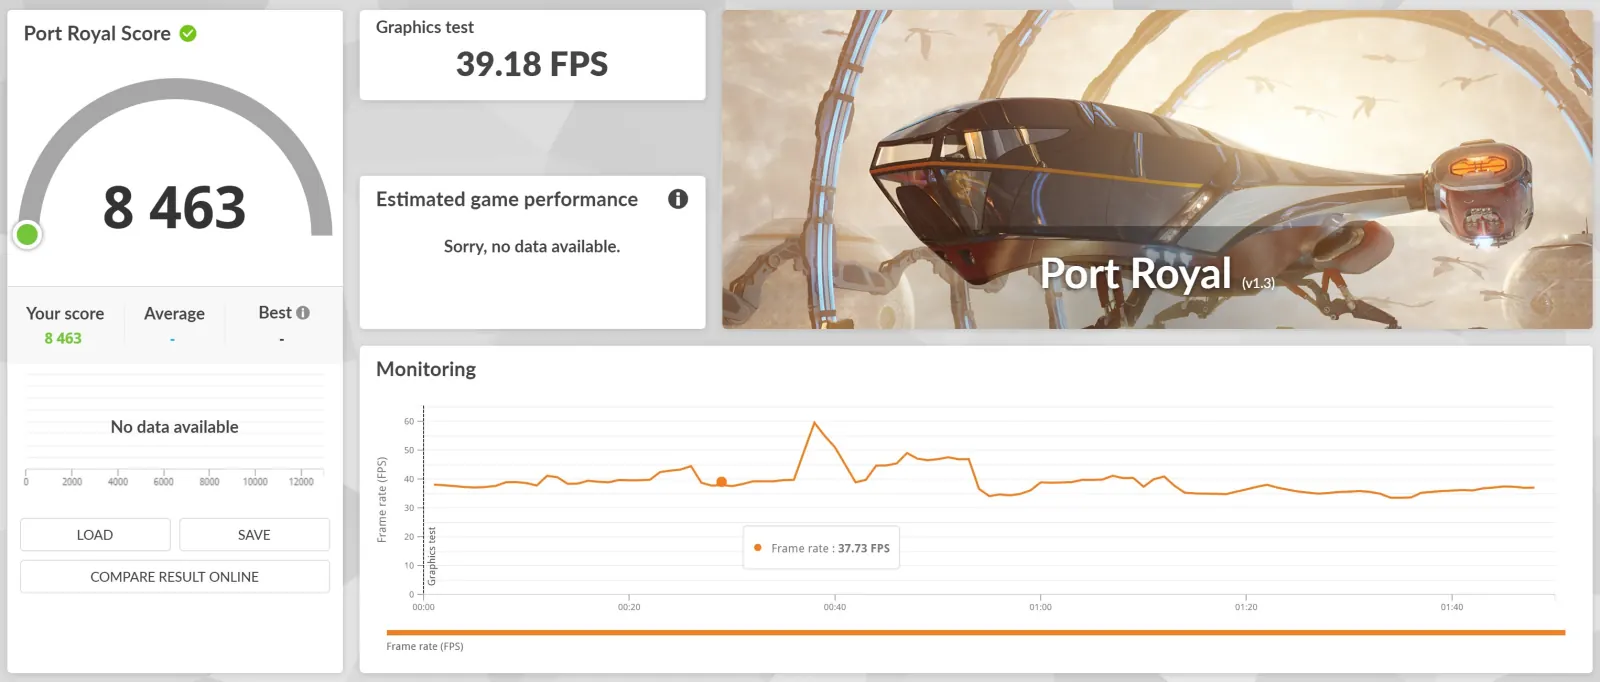
Wild Life
Caveats When Reading These Results
- 3DMark for Mac and 3DMark for Windows are separate programs with different versions, so the VM ÷ native value cannot be read purely as virtualization cost.
- A difference of a few percent may be measurement variance.
- VM numbers are for 4K full screen, and scores change when the output resolution changes.
- The Windows PC (RTX 4090) differs in OS, GPU, and display conditions, so we do not use it for rankings or head-to-head comparisons.
- Benchmark results do not guarantee compatibility or performance in individual games.
- These results come from one Mac (Apple M5 Max), so the ratios may differ on other chips.
Summary
- In 4 of the 5 benchmarks we compared, the Any OS VM reached about 90% of native or more: Solar Bay 129.9%, Steel Nomad Light 136.3%, Wild Life Extreme 92.7%, and Solar Bay Extreme 89.3%.
- The Any OS VM on a Mac performs between the NVIDIA RTX 4060 Ti and 4070, the level of a mid-range graphics card.
- All 5 DirectX 12 benchmarks ran in the VM without errors and produced scores. With Any OS, you can run DirectX 12 games on a Mac.